Every growth decision, entering a new geography, launching a product, raising a round, or greenlighting an acquisition, rests on one deceptively simple question: how big is the opportunity, really?
For decades, strategy teams answered it by lifting a headline figure from a syndicated report ("the global market is worth $X billion") and pasting it into a board deck. But a single number tells you almost nothing about the slice you can realistically win. The teams that allocate capital well don't ask "how big is the market?", they ask "how big is our market, this year, given our product, channel, and budget?"
This guide breaks down the three layers of market sizing, TAM, SAM, and SOM, explains the top-down and bottom-up methods used to calculate each, walks through a worked example, and flags the mistakes that quietly inflate forecasts.
72% of new-product and market-entry failures trace back to flawed demand assumptions, not execution. Sizing the opportunity correctly is the cheapest risk you can retire.
What is market sizing?
Market sizing is the process of estimating the total revenue opportunity available for a product or service within a defined market, and then narrowing that figure to the portion a specific company can realistically serve and capture. Done well, it converts a vague sense of "this looks big" into a defensible range that survives scrutiny from a board, an investment committee, or a due-diligence team.
A credible market-sizing exercise does three things: it defines the boundaries of the market precisely (which buyers, which use cases, which geographies), it quantifies demand using more than one method, and it states its assumptions transparently so others can challenge them. The number itself matters less than the logic that produces it.
TAM, SAM, and SOM defined
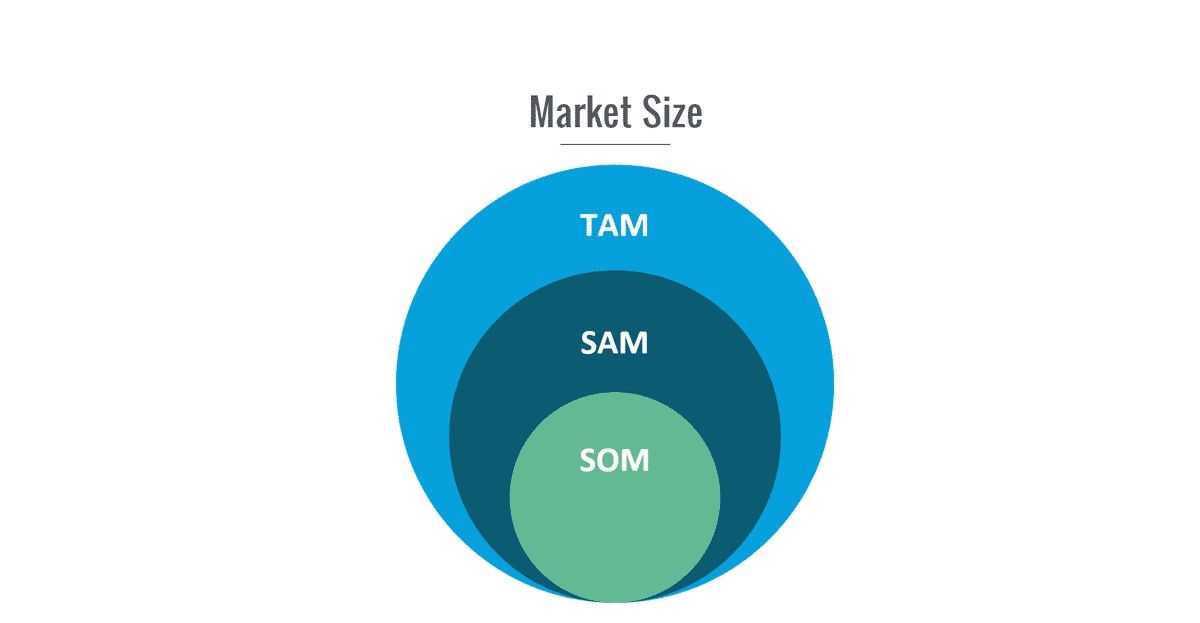
The standard framework breaks the opportunity into three nested layers, from the theoretical ceiling down to the realistic near-term prize.
TAM, Total Addressable Market
TAM is the total revenue available if every potential buyer in the world who could use your category bought from someone. It's the theoretical ceiling, useful for understanding the scale of the category and for signalling ambition to investors, but never the number you plan against.
SAM, Serviceable Addressable Market
SAM narrows TAM to the segment your business model can actually serve, constrained by geography, regulation, language, channel, price point, and product fit. If you sell only in North America, SAM excludes the rest of the world. If you serve only enterprises, it excludes SMBs. SAM is the realistic universe of demand you could pursue over time.
SOM, Serviceable Obtainable Market
SOM is the share of SAM you can realistically win in a defined period, typically one to three years, given your sales capacity, brand, competition, and budget. This is the number that belongs in your operating plan and revenue forecast. It is almost always a small fraction of SAM.
When everyone quotes the same multi-billion-dollar TAM, competitive advantage shifts to whoever has done the honest work of estimating their true SOM.
TAM inspires, SAM scopes, and SOM commits. Pitch with TAM, strategize with SAM, but budget and hire against SOM. Confusing the three is the single most common reason forecasts miss.
Top-down vs. bottom-up market sizing
There are two fundamental approaches to estimating each layer. Rigorous sizing uses both and reconciles the difference, a technique called triangulation.
Top-down market sizing
Top-down starts with a large, published market figure and applies a series of filters to narrow it to your segment. For example: global category revenue → your region's share → your sub-segment's share → your serviceable slice.
- Strengths: fast, easy to source from analyst reports and government data, good for establishing the category ceiling.
- Weaknesses: inherits the assumptions (and errors) of the source; the filtering percentages are often guesses; it tends to over-state the opportunity because it rarely accounts for real buying friction.
Bottom-up market sizing
Bottom-up builds the number from first principles: number of potential customers × adoption rate × average price × purchase frequency. You construct demand unit by unit from observable inputs.
- Strengths: grounded in real, defensible variables; forces you to understand your buyer and pricing; far more credible to investors and boards.
- Weaknesses: more time-intensive; requires accurate inputs on customer counts and willingness to pay, which usually demand primary research.
A top-down and a bottom-up estimate should land in the same ballpark. If they're an order of magnitude apart, one of your assumptions is wrong, and finding out which is where the real strategic insight lives.
A step-by-step framework for sizing a market
- Define the market precisely. Specify the buyer, the use case, the geography, and the time horizon. "SMB accounting software in the EU in 2026" is sizable; "fintech" is not.
- Estimate TAM top-down. Anchor on a credible category figure and document the source and year.
- Build SOM bottom-up. Count addressable customers, apply a defensible adoption rate, multiply by realistic price and frequency.
- Derive SAM in between. Apply only the structural filters your model truly imposes (geography, segment, regulation).
- Triangulate. Compare the top-down and bottom-up figures; investigate gaps until they reconcile within a sensible range.
- Pressure-test the assumptions. Validate adoption rates and willingness to pay with primary inputs, buyer interviews, surveys, or expert calls, rather than desk estimates alone.
- Express it as a range, with scenarios. Present conservative, base, and aggressive cases, and name the one or two variables that move the outcome most.
A worked example
Suppose a company sells a workflow tool to mid-market logistics firms and wants to size its 2026 opportunity. (Figures below are illustrative.)
- TAM (top-down): Global logistics-software spend is large, say the broad category is in the tens of billions. That's the ceiling, and largely irrelevant to next year's plan.
- SAM (structural filters): The company sells only in North America, only to firms with 50–500 employees, only an English-language product. Applying those filters yields, say, 18,000 qualifying firms with an average contract value of $24,000, a SAM of roughly $432 million.
- SOM (bottom-up, near-term): With current sales capacity the company can run ~600 qualified opportunities in 2026 at a 22% close rate → ~132 new customers × $24,000 → about $3.2 million in new ARR, on top of existing accounts.
The lesson: the headline "tens of billions" TAM and the operationally meaningful ~$3.2M SOM differ by four orders of magnitude. Planning against the former bankrupts companies; planning against the latter builds them.
Common market-sizing mistakes to avoid
- Anchoring on TAM. Presenting the category ceiling as the opportunity. Boards and serious investors discount it instantly.
- Single-method sizing. Using only top-down (inflates) or only bottom-up (can miss adjacent demand) without reconciling the two.
- Stale or mismatched sources. Borrowing a percentage from a five-year-old report, or mixing definitions across sources so the math silently breaks.
- Ignoring buying friction. Treating "could buy" as "will buy", skipping the adoption-rate reality check that primary research provides.
- Point estimates, not ranges. A single number invites false precision; a range with named sensitivities invites better decisions.
Frequently asked questions
What's the difference between TAM, SAM, and SOM?
TAM is the total worldwide revenue for your category, SAM is the portion your business model can serve (by geography, segment, and product fit), and SOM is the share of SAM you can realistically capture in the next one to three years. TAM is the ceiling; SOM is the plan.
Which is more accurate, top-down or bottom-up market sizing?
Bottom-up is generally more defensible because it's built from observable variables like customer counts and price, but the most reliable estimates use both methods and triangulate them. Large gaps between the two reveal flawed assumptions worth investigating.
How often should you re-size a market?
At least annually, and immediately before any major decision, a launch, market entry, raise, or acquisition. Fast-moving categories driven by technology or regulation can shift materially within a single year.
Can you size a market with no existing data?
Yes. When published data is thin, common in emerging or fragmented markets, bottom-up sizing built on primary research (buyer interviews, surveys, and expert calls) is the only credible path, and often the source of real competitive advantage.
What inputs make a bottom-up estimate credible?
An accurate count of addressable customers, a defensible adoption or penetration rate, a realistic average price, and a purchase frequency, each validated against primary evidence rather than assumption.
Future outlook
As AI makes generic market figures cheaper and more abundant, the value of a syndicated headline number is collapsing. When every competitor can generate the same top-down estimate in seconds, advantage migrates to the teams that do the harder work: defining the market precisely, building demand bottom-up, and pressure-testing every assumption against real buyers in real markets.
The question for any leader staring at a market-sizing slide isn't "is this number big?" It's "would this number survive an hour of hostile questioning?" If you can't answer yes, you don't have a market size, you have a guess wearing a suit.
Key takeaways
- TAM, SAM, SOM map the opportunity from theoretical ceiling to realistic near-term prize, pitch with TAM, plan with SOM.
- Use both top-down and bottom-up methods and triangulate; large gaps signal broken assumptions.
- Primary research on adoption and willingness-to-pay is what separates a defensible estimate from a guess.
- Present a range with scenarios, not a single point estimate.
Ready to size your market with confidence?
Zapulse builds bottom-up market models validated against primary interviews and our global expert network, delivered in days, not quarters.
Talk to our analystsRelated reading: Primary vs. Secondary Research · The Competitive Intelligence Framework · Market & Industry Analysis services
By Zapulse Research Team · Published Jun 15, 2026 · 9 min read · Research Methodology